Mish's Global Economic Trend Analysis |
- Hikes Keep On Slippin', Slippin', Slipin' Into the Future; Treasury Yields Sink Again
- Factory Orders Hit the Skids, Last Month Revised Lower, Shipments Down 4th Time in 5 Months
- Payroll Disaster: Establishment Survey +142K Jobs, Employment -236K; Labor Force -350K; 59K Downward Revisions
| Hikes Keep On Slippin', Slippin', Slipin' Into the Future; Treasury Yields Sink Again Posted: 02 Oct 2015 12:37 PM PDT Treasury Yields Drop Again Curve Watcher's Anonymous notes a further plunge in yields today following the disastrous payroll and factory order reports. Yield on the 30-year long bond fell to 2.80% from 2.85% yesterday. Yield on the 10-year note once again sports a 1-handle at 1.97%, down from 2.03%.
Treasury Yields vs. Month and Year Ago 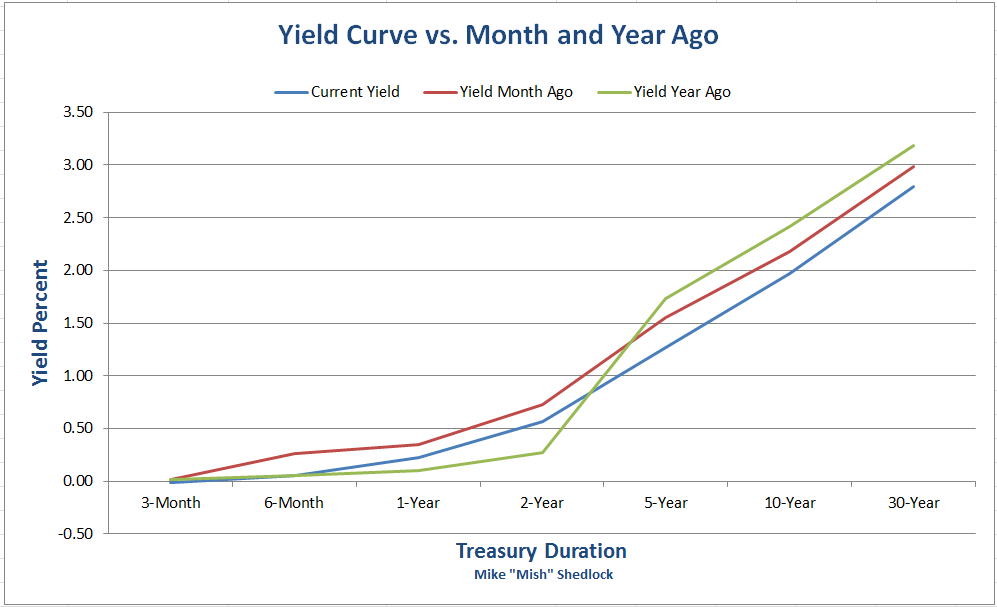 Data plotted from Bloomberg US Treasury Yields. Rate Hike Odds Curve Watcher's Anonymous also has an eye on rate hike odds. Here is a chart I put together on the evolution of rate hike odds. I captured two previous data points. Today I added October 2. 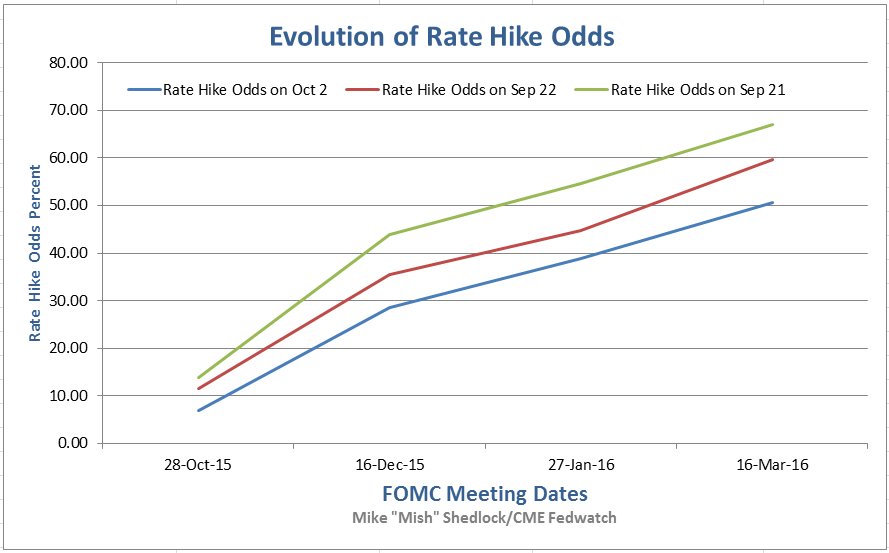 Data for the above from CME FedWatch.
The above table is a bit simplified because there is a chance of hikes bigger or smaller than a quarter point. However, I believe it is safe to discount multiple hikes until we at least see the first one. And following today's disastrous data reports, I think it is safe to rule out hikes this year. In honor of that statement and with a tip of the hat to my friend "BC" who suggested the song, I present this musical tribute. Slippin', Slippin', Slipin' Into the Future Link if video does not play: Time Keeps On Slipping Into The Future by Steve Miller Band. Today's Reports
I don't believe the Fed will hike into this weakness and nor does the market. Rate hike odds have been pushed all the way out to March of 2016 (and even then just barely above 50%). In addition, the flattening of the yield curve is outright recessionary. Mike "Mish" Shedlock | ||||||||||||||||||||||||||||||||||||||||||||||||||||||||||||||||||||
| Factory Orders Hit the Skids, Last Month Revised Lower, Shipments Down 4th Time in 5 Months Posted: 02 Oct 2015 09:41 AM PDT On top of today's disastrous jobs report, comes still more weakness in the factory sector. The US Census Bureau report on Manufacturers' Shipments, Inventories, and Orders shows:
The last two months have been a disaster, especially the ex-transportation numbers. The June-July overall reading of 0.2% was revised lower from the initial reading of 0.4% last month. Consensus Estimates The 1.7% decrease came in under the Bloomberg Consensus Estimate of -1.3%. The export-hit factory sector is in the headlines with orders for August down 1.7 percent and under the Econoday consensus for minus 1.3 percent. Orders for non-durable goods, pulled down by price weakness for petroleum and coal products, fell 1.1 percent on top of July's 1.4 percent decline. Orders for durable goods, initially released last week, are revised down to minus 2.3 percent vs an initial decline of 2.0 percent. And swings in aircraft are not distorting the picture as the ex-transportation reading is down 0.8 percent in August following July's 0.7 percent decline.Autos Once Again Bloomberg noted strong auto sales and also cautioned about "unwanted inventories". Actually, those two thoughts need to go together in a way Bloomberg did not mention. Auto sales are counted when shipped to dealers. If cars are sitting on dealer lots, the auto party is over. We will not find out for a while. Durable Goods New Orders  Durable Goods New Orders Excluding Transportation  These numbers will take a few ticks off the Atlanta Fed GDPNow Forecast currently sitting at 0.9% for the third quarter. For analysis of today's jobs report, please see Payroll Disaster: Establishment Survey +142K Jobs, Employment -236K; Labor Force -350K; 59K Downward Revisions. Mike "Mish" Shedlock | ||||||||||||||||||||||||||||||||||||||||||||||||||||||||||||||||||||
| Posted: 02 Oct 2015 08:24 AM PDT Initial Reaction This report was a veritable disaster. Although the establishment survey sported 142,000 jobs it was much weaker than expected. Downward revisions for the last two months totaled 59,000. The labor force fell by 350,000 driving the participation rate to a 40-year low. Government jobs rose 24,000 so private payrolls accounted for a mere 118,000 jobs. Weekly hours ticked down by 0.1 hours. Topping off the disastrous set of numbers, employment declined by 236,000. Consensus Estimates The Bloomberg Consensus estimate was 203,000 jobs total with 195,000 private sector jobs. The actual numbers were well outside of any economist's estimate. The lowest estimate for total jobs was 180,000. The lowest total for private jobs was 175,000. The latter missed by 57,000 jobs! Revisions Last month I noted, the preceding two months were revised up by 44,000. It seems something went wrong. The change in total nonfarm payroll employment for July was revised from +245,000 to +223,000, and the change for August was revised from +173,000 to +136,000. With those revisions, employment gains in July and August combined were 59,000 less than previously reported. BLS Jobs Statistics at a Glance
September 2015 Employment Report Please consider the Bureau of Labor Statistics (BLS) Current Employment Report. Total nonfarm payroll employment increased by 142,000 in September, and the unemployment rate was unchanged at 5.1 percent, the U.S. Bureau of Labor Statistics reported today. Job gains occurred in health care and information, while mining employment fell. Unemployment Rate - Seasonally Adjusted  Nonfarm Employment  Click on Any Chart in this Report to See a Sharper Image Nonfarm Employment Change from Previous Month by Job Type  Hours and Wages Average weekly hours of all private employees fell by 0.1 hours to 34.5 hours. Average weekly hours of all private service-providing employees was flat at 33.4 hours. Average hourly earnings of production and non-supervisory private workers was flat at $21.08. Average hourly earnings of production and non-supervisory private service-providing employees rose $0.01 to $20.90. For discussion of income distribution, please see What's "Really" Behind Gross Inequalities In Income Distribution? Birth Death Model Starting January 2014, I dropped the Birth/Death Model charts from this report. For those who follow the numbers, I retain this caution: Do not subtract the reported Birth-Death number from the reported headline number. That approach is statistically invalid. Should anything interesting arise in the Birth/Death numbers, I will add the charts back. Table 15 BLS Alternate Measures of Unemployment  click on chart for sharper image Table A-15 is where one can find a better approximation of what the unemployment rate really is. Notice I said "better" approximation not to be confused with "good" approximation. The official unemployment rate is 5.1%. However, if you start counting all the people who want a job but gave up, all the people with part-time jobs that want a full-time job, all the people who dropped off the unemployment rolls because their unemployment benefits ran out, etc., you get a closer picture of what the unemployment rate is. That number is in the last row labeled U-6. U-6 is much higher at 10.0%. Both numbers would be way higher still, were it not for millions dropping out of the labor force over the past few years. Some of those dropping out of the labor force retired because they wanted to retire. The rest is disability fraud, forced retirement, discouraged workers, and kids moving back home because they cannot find a job. Rate Hikes By the way, forget about rate hikes. Mike "Mish" Shedlock | ||||||||||||||||||||||||||||||||||||||||||||||||||||||||||||||||||||
| You are subscribed to email updates from Mish's Global Economic Trend Analysis. To stop receiving these emails, you may unsubscribe now. | Email delivery powered by Google |
| Google Inc., 1600 Amphitheatre Parkway, Mountain View, CA 94043, United States | |
No comments:
Post a Comment